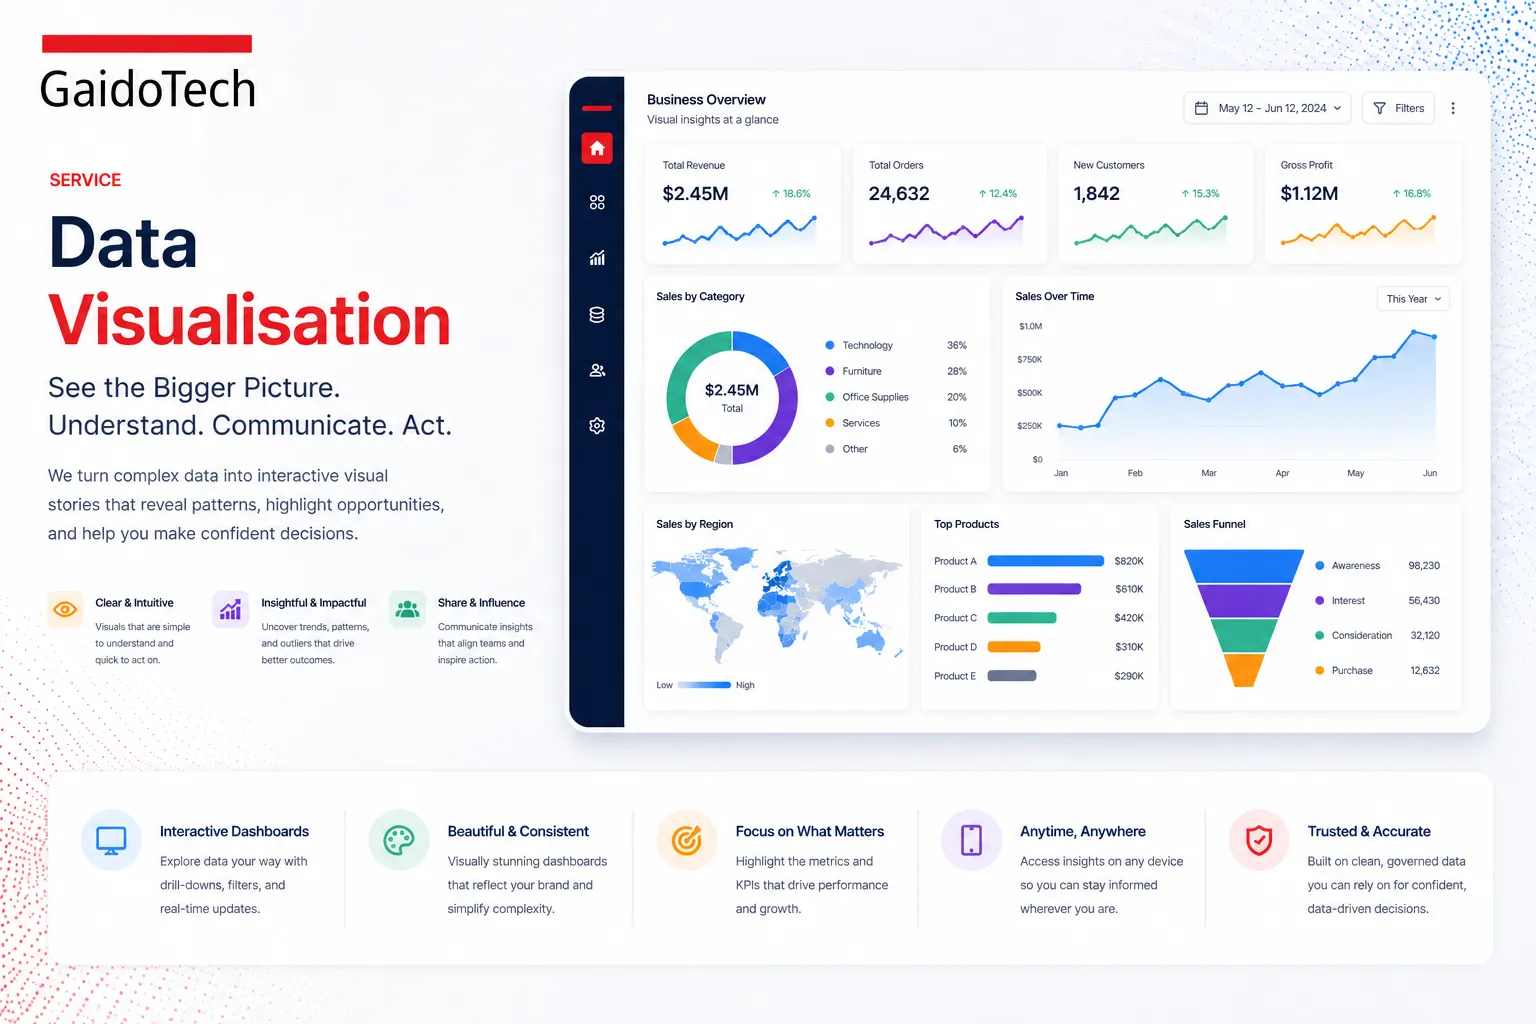
Data Visualisation
Turn complex datasets into compelling visual stories through intuitive charts, graphs, and interactive maps. Make your data impossible to ignore and easy to understand.
The Problem
What's Included
Benefits
Communicate insights instantly with visual clarity
Engage stakeholders who don't speak 'data'
Spot trends and outliers at a glance
Present data that drives action, not confusion
Who It's For
Teams presenting data to non-technical stakeholders
Marketing departments needing compelling data stories
Any business tired of dense spreadsheets and tables
How It Works
Hover each step to see details
Use Cases
Visualise every touchpoint from first click to conversion with interactive flow diagrams.
Technology We Use
Best-in-class tools tailored to your needs
Our Process
How we deliver Data Visualisation
Discovery & Assessment
We learn your business, audit your data landscape, and identify the highest-impact opportunities.
Strategy & Roadmap
We co-create a tailored BI roadmap with clear milestones, tool recommendations, and success metrics.
Data Integration
We connect your data sources into a unified, reliable pipeline — clean, consistent, and ready for analysis.
Build & Visualise
We design and build interactive dashboards and reports that surface the insights that matter most.