Analytics & Reporting
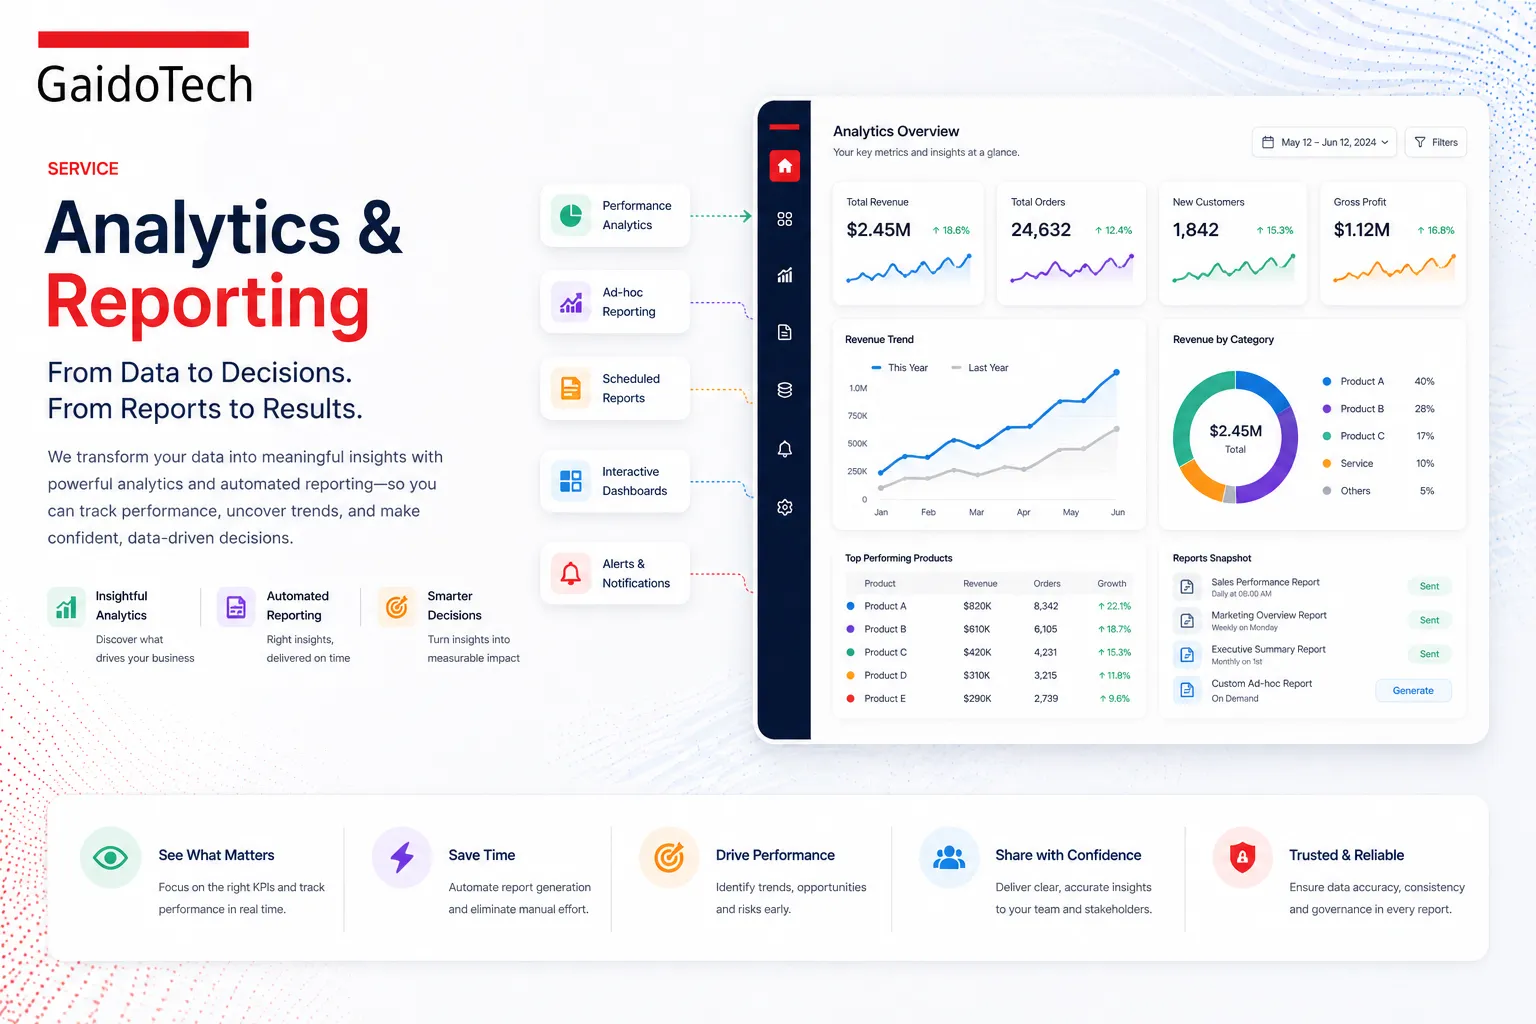
Transform raw data into meaningful reports with interactive dashboards, scheduled reporting, and real-time KPI tracking. Know exactly how your business is performing — every day, every metric.
The Problem
What's Included
Benefits
Replace hours of manual reporting with automated dashboards
Surface insights in real-time, not days later
Empower every team with self-service analytics
Make data-driven decisions with confidence
Who It's For
Executive teams needing real-time performance visibility
Operations managers tracking daily KPIs
Finance teams automating monthly reporting cycles
How It Works
Hover each step to see details
Use Cases
A live view of revenue, margins, and growth metrics updated in real-time for leadership.
Technology We Use
Best-in-class tools tailored to your needs
Our Process
How we deliver Analytics & Reporting
Discovery & Assessment
We learn your business, audit your data landscape, and identify the highest-impact opportunities.
Strategy & Roadmap
We co-create a tailored BI roadmap with clear milestones, tool recommendations, and success metrics.
Data Integration
We connect your data sources into a unified, reliable pipeline — clean, consistent, and ready for analysis.
Build & Visualise
We design and build interactive dashboards and reports that surface the insights that matter most.